
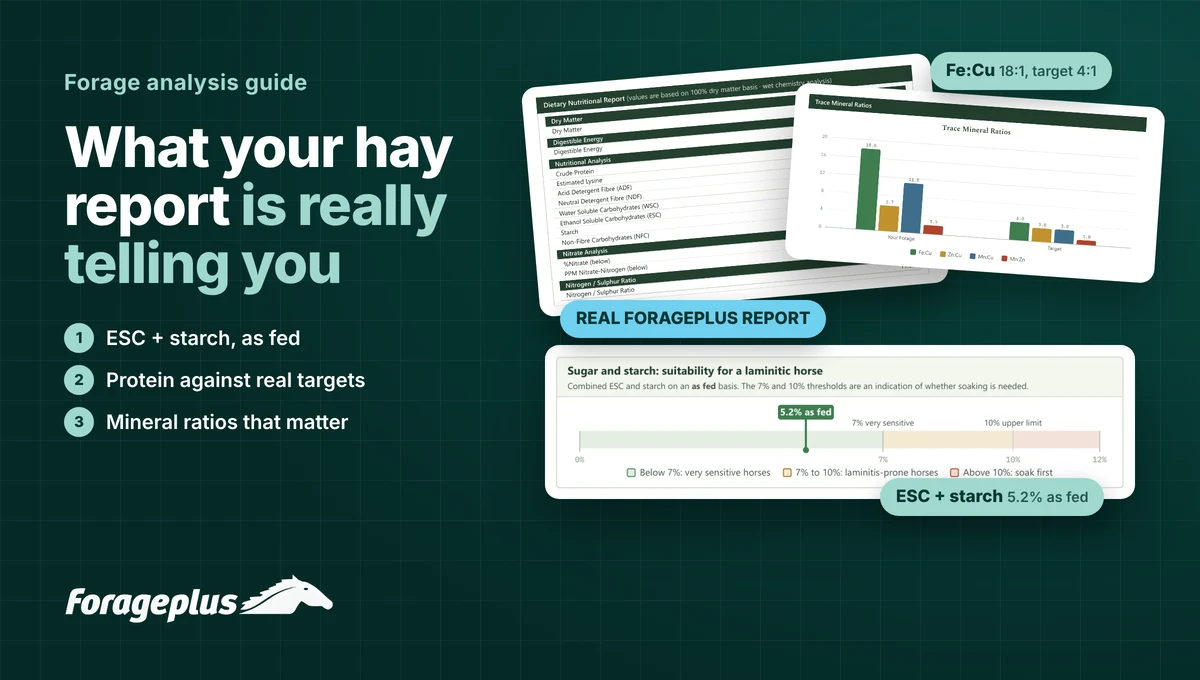
How to read the sugar, starch, protein and mineral figures on your hay or haylage report, and what a good result looks like for your horse.
Written by Sarah Braithwaite, founder of Forageplus, drawing on more than 12,500 UK forage samples our team has analysed since 2005.
In this guide
Forage makes up most of your horse’s diet, so it is the place to start. A forage analysis shows what your hay or haylage supplies, so you can add only what is missing. This guide walks through each section of a typical report in the order you will meet it.

1. Dry matter or as fed: read this first
Most reports show two columns of figures. Which one you use changes the answer, so check this first.
- Moisture: the percentage of water in the sample.
- Dry matter (DM): everything left once the water is removed.
- As fed (also called as sampled or as received): figures with the water included, which is what your horse actually eats.
- Dry matter basis: figures with the water taken out. Laboratories report this way so different forages can be compared.
Dry matter figures are useful for comparing one hay with another, and for working out how much forage to feed. But when you are judging your hay against your horse’s needs, we use the as fed figures. These show what your horse receives in each mouthful, and they are what Dr Eleanor Kellon VMD and the ECIR Group use for sugar and starch.
How to convert a figure to as fed
As fed value = dry matter value × (dry matter % ÷ 100)
Example from a real report: a hay at 82.2% dry matter with 9.2% crude protein on a dry matter basis supplies 9.2 × 0.822 = 7.6% protein as fed.
Dry matter also explains why haylage is fed in greater weights than hay. 10kg of hay at 90% dry matter supplies 9kg of dry matter, while a haylage at 50% dry matter would need to be fed at 18kg to supply the same amount. We take this into account when advising how much forage to feed. You can read more in our guide to understanding dry matter.
Free tool
Check your own hay report
Enter four figures from your hay or haylage analysis. We will convert them to as fed and show where your forage sits for sugar, starch and protein.
Our NIR nutritional analysis reports WSC, ESC and starch separately, with these as-fed scales already worked out for you. From £49.96, with no kit to wait for.
Usually near the top of the report
Most labs, including ours, report on a dry matter basis
Ethanol-soluble carbohydrates (simple sugars)
Water-soluble carbohydrates
Enter your dry matter, ESC, starch and crude protein to see your results.
Thresholds follow Dr Eleanor Kellon VMD and the ECIR Group, applied as fed. Results are a guide based on the figures you enter and are not a substitute for advice on your individual horse.
2. Energy, protein and fibre
Digestible energy (DE)
DE estimates the calories your horse can obtain from the forage, shown in megajoules per kilogram (MJ/kg). Low sugar and starch is not the same as low calorie: a hay can be low in ESC and starch yet still energy dense enough to cause weight gain if fed ad lib. For good doers, MJ/kg is one of the most important figures on the report, because it sets how much forage can be fed for weight loss while still supplying enough fibre for gut health. For poor doers, it shows how many extra calories the bucket feed needs to supply.
Crude protein (CP)
Crude protein is calculated from the nitrogen content. It shows the quantity of protein but not its quality, which depends on the essential amino acids, particularly lysine. We use a minimum of 8% crude protein as fed for a healthy adult horse at maintenance, with an optimal target of 10.4% as fed. Young, growing, working and older horses, and pregnant or lactating mares, need more again. How much forage your horse eats each day matters too, so we also look at the total protein supplied by the daily forage intake.
Many UK forages fall short here. Across the samples we have tested, 85% contain less than 8% crude protein as fed, and many average around 6%. Older horses also use dietary protein less efficiently as their teeth wear, so their protein often needs topping up through the bucket feed.
Lysine
Lysine is the first limiting amino acid for horses, meaning it usually runs out first. It is needed for growth, muscle and tissue repair. Lysine is reported as an estimate, but many UK forages do not contain enough to meet the needs of growing horses, breeding stock and horses in work. Forage that is low in crude protein is almost always low in lysine too.
Protein quality: the nitrogen to sulphur ratio
Where a mineral analysis is also carried out, your report includes the nitrogen to sulphur (N:S) ratio, an indicator of protein quality. An ideal ratio is 10:1 or lower. Higher ratios suggest the sulphur amino acids, particularly methionine, may be limiting, and that adding methionine and other essential amino acids would improve the quality of the protein in the diet.
ADF and NDF
Acid detergent fibre (ADF) and neutral detergent fibre (NDF) measure the fibre fractions. Higher values usually mean a more mature, stemmy forage with less energy, which can suit good doers. Lower values mean a softer, more digestible forage that may suit horses needing condition. NDF is also linked to how much a horse will eat: as NDF rises, horses generally eat less, because the forage stays in the gut for longer.
You may also see NFC (non-fibre carbohydrates), a calculated figure covering sugars, starch and pectins. It is useful for the overall profile, but less valuable than ESC and starch when judging suitability for laminitis.
3. Sugar and starch: ESC, WSC and starch
Owners of laminitis-prone horses usually turn to this part of the report first. A full carbohydrate breakdown reports three figures:
| Figure | What it measures | Why it matters |
|---|---|---|
| WSC water-soluble carbohydrates |
Total sugar: simple sugars plus fructans | Includes fructans, which have little effect on insulin, so it can overstate the risk |
| ESC ethanol-soluble carbohydrates |
Simple sugars | The sugars that raise blood glucose and insulin |
| Starch | Starch, digested to glucose | Raises insulin, and is not removed by soaking |
The figure to check: ESC + starch
For horses and ponies with insulin dysregulation, EMS, PPID or a history of laminitis, add the ESC and starch figures together. This will give you the hydrolysable carbohydrate level. Following Dr Kellon and the ECIR Group, we apply these thresholds on an as fed basis:
- Below 7%: suitable even for very sensitive horses.
- 7% to 10%: suitable for most laminitis-prone horses.
- Above 10%: soak before feeding.
Fructans, included in WSC, are fermented in the hind gut rather than digested to glucose, so they produce little insulin response. They do still add calories, which is why they matter when working out how much hay to feed rather than whether it is safe.
Why we do not use NSC
Some laboratories, and many feed labels, give an NSC (non-structural carbohydrate) figure instead. On most forage reports NSC is WSC plus starch, so it includes fructans as well as the sugars and starch that raise insulin.
That makes NSC read higher than ESC + starch, often by several percentage points. Judged against the 10% threshold, it can make a perfectly suitable hay look unsafe, so it ends up being soaked or rejected when there is no need. This is why Dr Kellon and the ECIR Group use ESC + starch for insulin-resistant horses, and why we do too.
Soaking a hay that does not need it is not harmless. Soaking removes energy, protein and minerals along with the sugar, so your horse gets less of the nutrition it needs from the same amount of hay. For a metabolic horse already on a weight-loss diet, that can tip the diet into too few calories, and prolonged underfeeding can make insulin resistance worse rather than better, keeping the horse in the very state you are trying to improve. We explain this in more detail in Can underfeeding metabolic horses worsen insulin resistance?
If a report or feed label only gives NSC, it tells you the upper limit, not the figure you need. Look for the ESC and starch figures, or ask the manufacturer for them.
From a real Forageplus report
This meadow hay tested at 82.2% dry matter. On a dry matter basis it showed WSC 17.4%, ESC 8.9% and starch 1.0%. Judged on WSC alone, it would be rejected for a laminitis-prone horse, or soaked for many hours.
ESC + starch is 9.9% on a dry matter basis, and as fed 9.9 × 0.822 = 8.1%. It suits most laminitis-prone horses without soaking, though not the most sensitive, who need below 7%.
The same hay showed 9.2% protein on a dry matter basis, which looks adequate, but only 7.6% as fed, below the 8% minimum.
What the report looks like
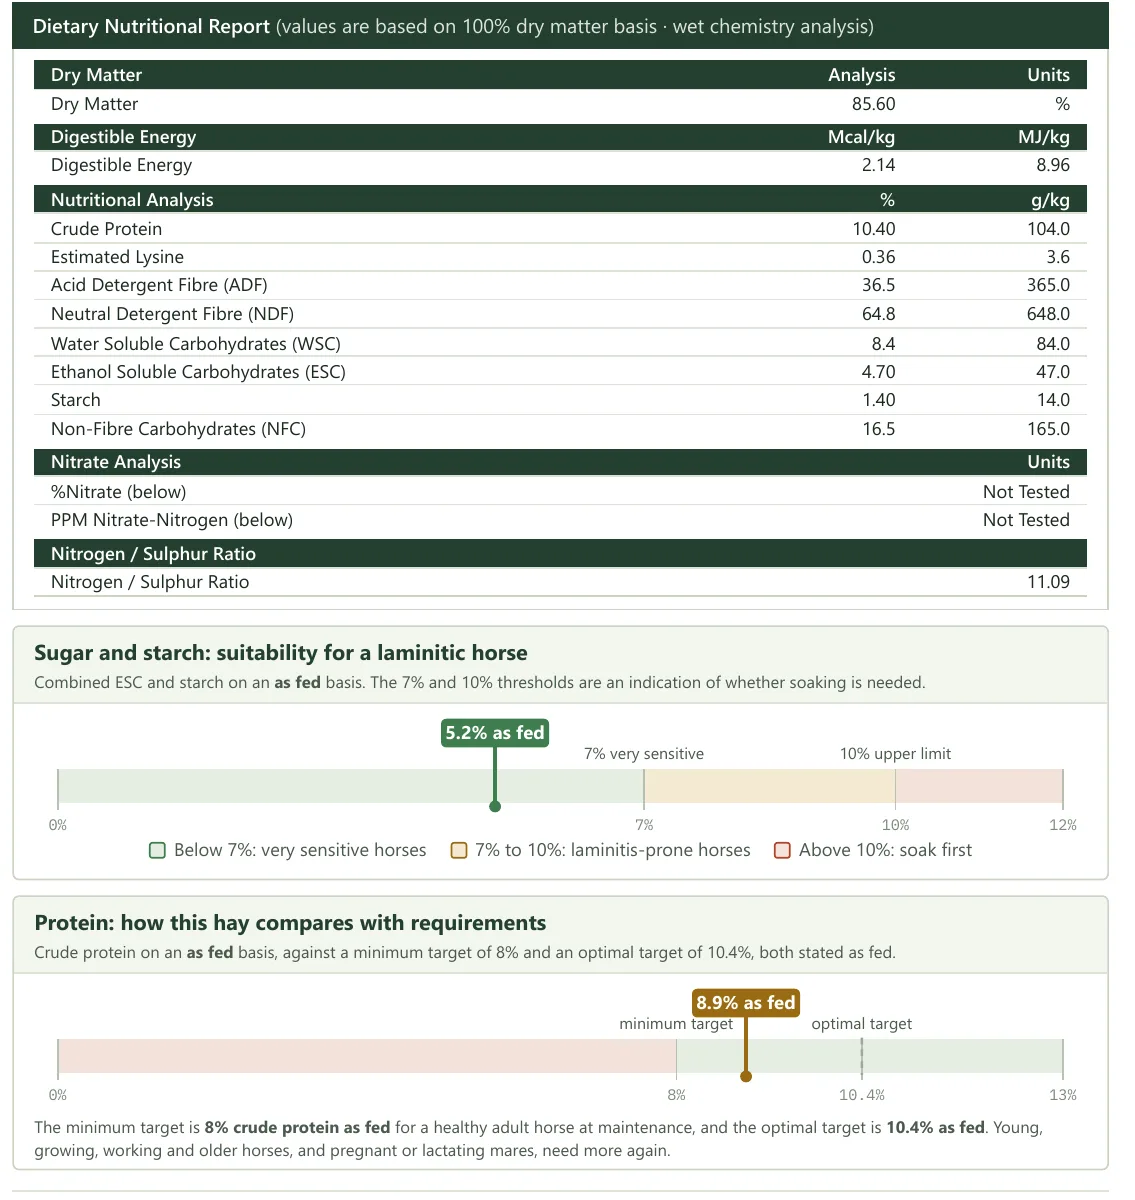
Here is the nutritional page of a Forageplus report for a 2026 UK meadow hay, tested by wet chemistry. Every Forageplus report converts the key figures to as fed for you and plots them against the thresholds above.
Reading this report
- Dry matter 85.6%. Every as-fed figure is the dry matter figure × 0.856.
- ESC + starch (hydrolysable carbohydrates): 4.7% + 1.4% = 6.1% on a dry matter basis, or 5.2% as fed. Suitable even for very sensitive horses, with no soaking needed.
- Crude protein: 10.4% on a dry matter basis, or 8.9% as fed. Above the 8% minimum, but below the 10.4% optimal target.
- N:S ratio 11.09. Just above the 10:1 ideal, so methionine may be limiting protein quality.
- Digestible energy 8.96 MJ/kg on a dry matter basis. This sets how much can be fed to a good doer.
Judging hay on WSC alone, or on dry matter figures, can rule out perfectly suitable forage. That leads owners to soak hay that does not need it, which washes out nutrients, especially sodium. Most owners who test find they do not need to soak at all. Where soaking is needed, a short soak of around 30 minutes is enough, with extra salt while soaking continues. Our guide to soaking hay explains more.
If your horse has a history of laminitis, EMS or PPID, use your forage analysis alongside advice from your vet.

4. Minerals and the ratios that matter
Minerals compete with each other for absorption. Too much of one can block the uptake of another, so the ratios between them matter as much as the amounts. A full mineral analysis shows what your forage lacks, so supplements can be targeted.
Calcium and phosphorus
Calcium and phosphorus build and maintain bone, and phosphorus is central to energy production in every cell. Calcium should always be higher than phosphorus, but the ideal ratio depends on the horse:
| Horse | Target Ca:P |
|---|---|
| Adult horse, maintenance or light work | As close to 2:1 as possible |
| Adult horse, moderate work | About 1.6:1 |
| Adult horse, heavy work | About 1.37:1 |
| Growing horse | About 1.8:1 |
| Mare, last trimester of pregnancy | About 1.3:1 |
| Lactating mare | About 1.5:1 |
Calcium and magnesium
For adult horses with normal metabolism we aim for a Ca:Mg ratio of 2:1 or slightly under, depending on phosphorus levels. For metabolic horses, including those with EMS, PPID or insulin dysregulation, we aim for 1.5:1. For young horses the calcium to phosphorus ratio is the priority. UK forage plus a bucket feed always supplies enough magnesium for youngstock, which is why our young horse balancers do not add it.
Copper, zinc, iron and manganese
These four trace minerals interact strongly. High iron and manganese interfere with copper and zinc, so the amount of copper and zinc to add depends on how much iron and manganese the forage contains.
| Copper | Iron | Manganese | Zinc | |
|---|---|---|---|---|
| Ideal (Dr Kellon) | 1 | 4 | 3 | 3 |
| NRC | 1 | 4 | 4 | 4 |
These are ideal levels, and UK forage rarely matches them. In practice:
- Iron can be higher, up to 10 parts iron to 1 part copper, provided copper and zinc are balanced to it.
- Manganese can also run high, as long as copper and zinc are balanced to the iron.
- For metabolic horses (EMS, PPID or insulin dysregulation), iron should be no more than 4:1 to copper, or where necessary lower, to achieve a beneficial balance across these four trace minerals.
A real mineral report, explained
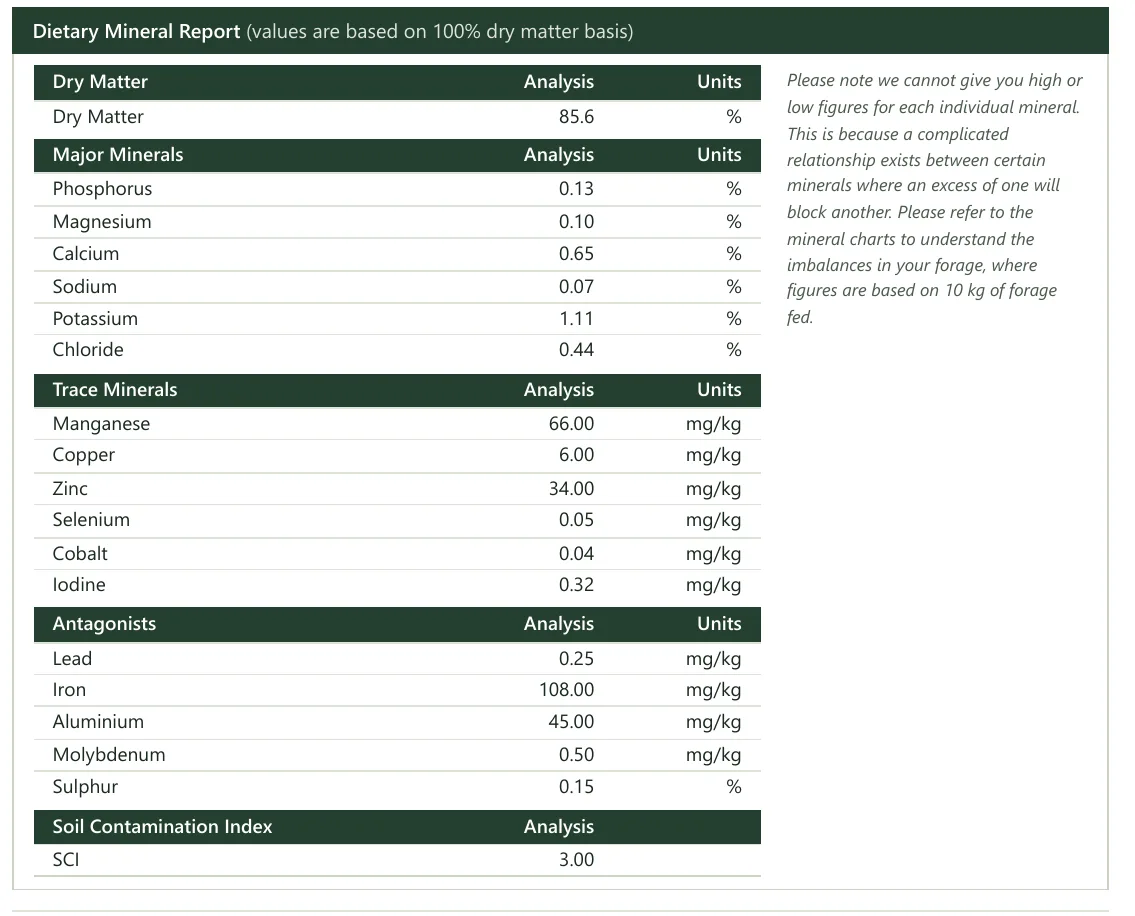
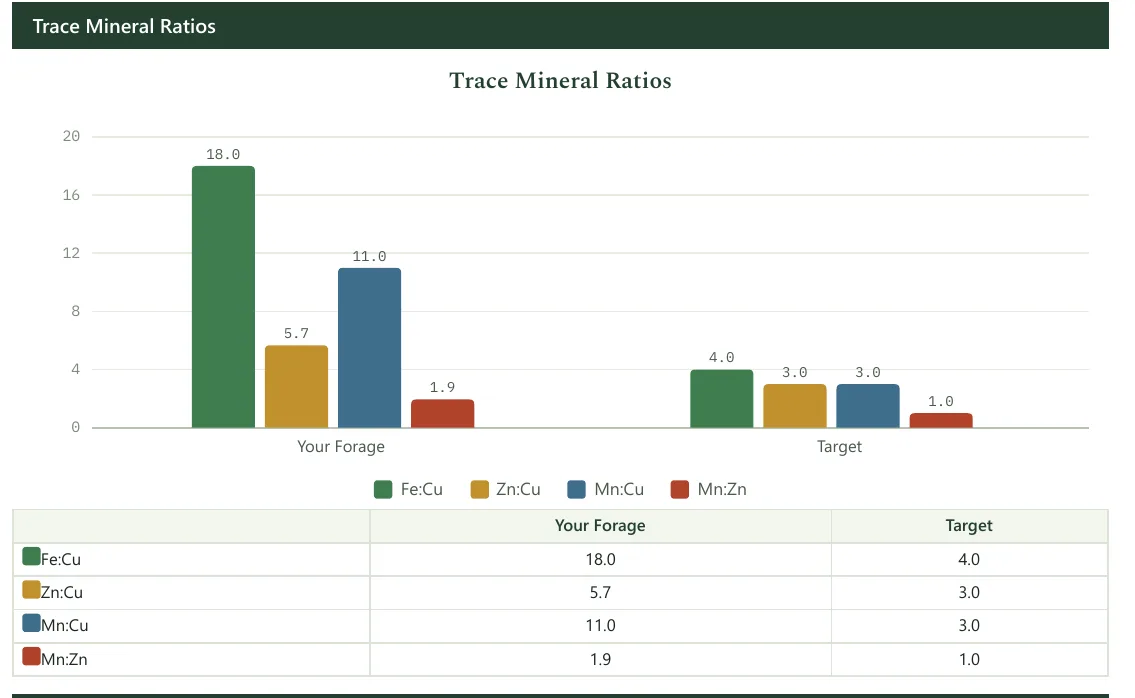
These are the mineral pages from the same 2026 meadow hay. Figures are on a dry matter basis.
Reading this report
- Iron to copper 18:1 (108 mg/kg iron, 6 mg/kg copper). Well above the 10:1 upper limit, so copper needs adding.
- Manganese to zinc 1.9:1 and zinc to copper 5.7:1. Zinc needs adding as well as copper to reach the ratios.
- Calcium to phosphorus 5:1 and calcium to magnesium 6.5:1. Phosphorus and magnesium are both short against calcium.
- Selenium 0.05 mg/kg and sodium 0.07%. Both low, as in most UK forage. With potassium at 1.11%, potassium to sodium is about 16:1, above the 10:1 limit, so salt is essential.
- Soil Contamination Index 3, which is low.
This is the typical UK pattern described below. Each mineral looks unremarkable on its own, but the ratios show what needs correcting. For this reason the report does not label individual minerals high or low; the charts show each one for 10kg of forage against 1.5 times the NRC requirement.
Young horses
For growing horses we aim for protein and the major minerals at 150% of NRC requirements, and the trace minerals at 300%. UK forage nearly always supplies far more iron than this already, so in practice it is copper and zinc that need adding.
Other minerals on a full mineral report
| Sodium and chloride | Fluid and electrolyte balance. Forage is almost always low, so salt is needed daily. Potassium should be no more than 10 times sodium. |
| Potassium | Fluid balance, muscle and nerve function. Usually plentiful in forage. |
| Selenium | Antioxidant function. It has a narrow safe range, so testing avoids feeding too little or too much. |
| Iodine | Thyroid hormone production. |
| Sulphur and molybdenum | Both interact with copper: copper uptake is further compromised when molybdenum is more than 50% of copper. Sulphur is also part of biotin, thiamine and the sulphur amino acids. |
| Cobalt | Used by gut microbes to make vitamin B12. |
| Soil Contamination Index | Scored out of 10, where 6 is average. Samples are tested as received, because any soil and dust is part of what your horse eats. |
5. What we see in UK forage
We have analysed more than 12,500 UK forage samples, one of the largest equine forage datasets in the country. The same pattern appears year after year:
- Copper, zinc and magnesium are consistently too low.
- Iron, manganese and calcium are consistently too high, and they are the minerals that block copper and zinc.
- Protein is usually short. 85% of samples contain less than 8% crude protein as fed.
- Iron and manganese are highest on short, sparse, stressed grazing.
Weather changes the detail from one year to the next, but the overall picture holds. Many feeds and supplements add more iron, manganese and calcium, making the imbalance worse. We formulate our balancers from analysis data for this reason.
A note on grass
We test grass for minerals only. Sugar levels in grass change through the day and with the weather, so a single nutritional result is not a reliable guide to what your horse is eating. Hay and haylage can be tested for both.

6. Which analysis do you need?
| Analysis | What it tells you | Best for |
|---|---|---|
| NIR nutritional | Energy, protein, fibre, and the full carbohydrate breakdown (WSC, ESC and starch) | Checking sugar and starch for laminitis-prone horses. Our most popular test. |
| Wet chemistry nutritional | The same figures, measured by the gold standard method | When you want the most precise result |
| Full mineral | Major and trace minerals, plus the Soil Contamination Index | Balancing minerals accurately |
| Mycotoxin | 37 mycotoxins | Only where forage smells fusty or shows visible mould |
For the full picture, combine a nutritional analysis with a full mineral analysis. There is no kit to wait for: we email sampling instructions as soon as you order, and you post the sample to us. Reports usually arrive within 10 to 14 working days. See our guide to taking forage samples.
Consider adding a nitrate test where protein is unusually high, where there was drought while the forage was growing, or where the forage is for pregnant mares.
What happens after your results arrive
Once we have your results and your horse’s details, our nutritionists can suggest a balancer and any extras, such as an additional scoop of copper or magnesium, matched to your forage. Our range of forage-focused balancers usually has a close match for most UK forage.
What is in your horse’s hay?
Full sugar and starch breakdown, protein and minerals, with expert interpretation from our nutrition team.
Frequently asked questions
What is a good hay analysis for horses?
It depends on the horse. For laminitis-prone or metabolically sensitive horses (EMS, PPID or insulin dysregulation), look for hydrolysable carbohydrates (ESC + starch) below 10% as fed. Horses that are not metabolically sensitive, particularly those in work, often benefit from a higher hydrolysable carbohydrate (ESC + starch) level, as it provides more energy. For all horses, aim for at least 8% crude protein as fed and a mineral profile that can be balanced easily. In practice, few UK hays meet every target. Testing shows where your hay falls short, so you can correct it.
Should I use the dry matter or as-fed figures?
Use dry matter figures to compare one forage with another and to work out how much to feed. Use as-fed figures to judge sugar, starch and protein against your horse’s needs, because that is what your horse receives in each mouthful.
What hydrolysable carbohydrate (ESC + starch) level is suitable for a laminitis-prone horse?
Below 10% as fed for most horses with insulin dysregulation, and below 7% for very sensitive individuals, following Dr Kellon and the ECIR Group. Check hydrolysable carbohydrates (ESC + starch) rather than WSC, which includes fructans and can rule out suitable hay unnecessarily.
Do I need to soak my hay?
Only if the analysis shows hydrolysable carbohydrates (ESC + starch) above target. Most owners who test find they do not need to soak. If you do soak, around 30 minutes is enough, and add extra salt to replace the sodium that is lost. If your hay needs soaking for longer than 30 minutes, we will tell you in your report.
Can you test grass for sugar?
No. Grass sugar changes through the day and with the weather, so a single result is not reliable. We test grass for minerals only. Hay and haylage can be tested for both nutrition and minerals.
How long do forage analysis results take?
Allow 10 to 14 working days from when we receive your sample, although most reports come back sooner.


