The numbers and statistics for horse feed balancers and choosing which one is best to feed your horse can be confusing. How do you choose the best horse feed balancer?
Here we explain how we start with the forage; grass, hay or haylage, we test from all over the UK and Europe and formulate our formulas for Forageplus horse feed balancers.
The best balancer for horses
We are surrounded by numbers, data and statistics that are often used to justify actions and arguments by parties who know the average layperson will often be confused by the figures. Politicians are notorious for doing this, picking and choosing numbers and statistics to justify their political agenda.
It is extremely important therefore that whenever numbers and statistics are being presented they are backed up by solid rigorous analysis.
Forageplus Horse Feed Balancer Database
Forageplus has built up a substantial database for the mineral and nutritional content of UK and European forage over several years. This valuable database resource is what we use to direct the formulation of our horse feed balancer product range and to advise our clients on the optimum way of supporting their horse’s health.
Because our core business is based on this valuable database and the statistics derived from it we feel it important to be transparent about how we handle the data and derive the key statistical information.
The purpose of this article is to explain our approach as simple as we can however the article is still quite technical and we urge anyone who wants further information or clarification on any of the points made to contact us and we’ll do our best to answer your questions.
Understanding Forageplus Horse Feed Balancer Statistics
The XY Scatter Plot
Imagine we have a set of X-variables and Y-responses we can plot these together using a simple two-dimensional XY-scatter plot.
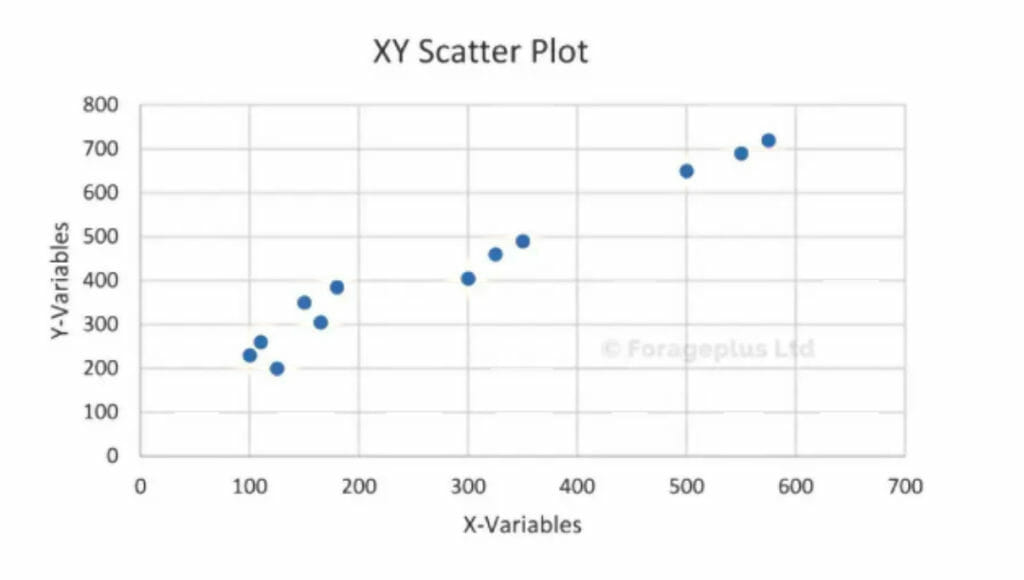
We can see from this data that there appears to be a straight line trend in the data. We can, therefore “fit” a straight line to this data using a method known as least squares. The goodness of this fit, that is, how well the straight line “models” the actual data is represented by a value termed R-squared (R2), this is shown below:
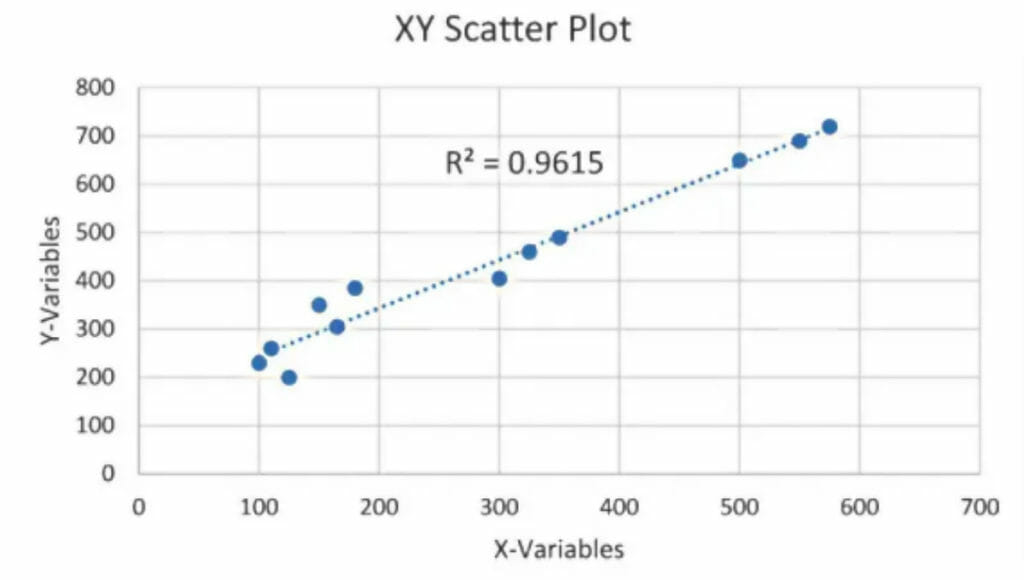
The closer R2 is to the number 1 the better the fit. When R2=1 all the data points lie exactly on the line. The line is often referred to as a “model” because it is a representation of the overall trend in the data. The line or “model” is important because we can use it to predict other values by extrapolation for example new points represented by the red line below.
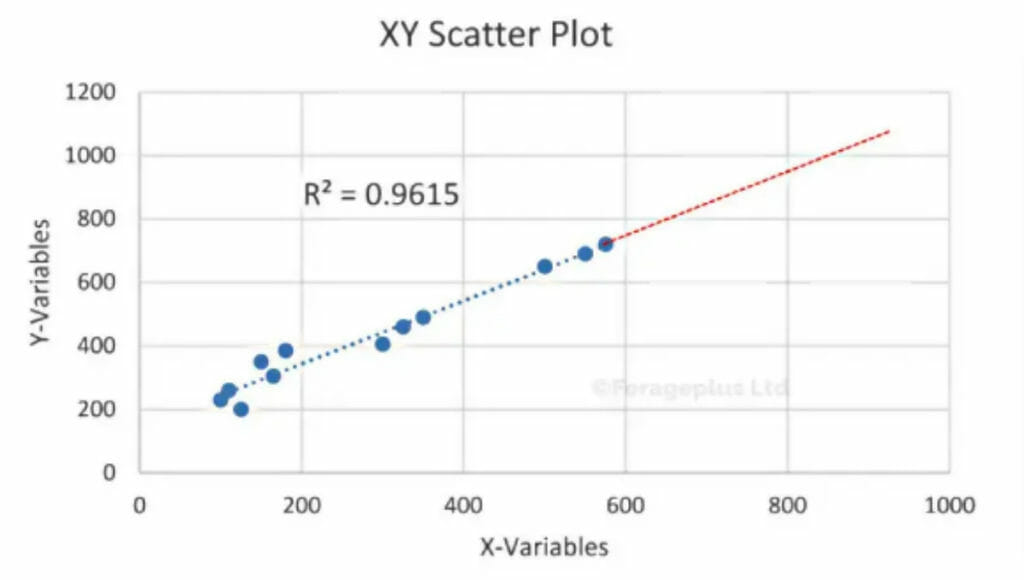
A measure of how well a model predicts is represented by another value known as Q-squared (Q2) and just like R2, the closer Q2 is to one then the better the predictive ability of the model.
Using Multivariate Analysis to Formulate the Best Horse Feed Balancer
The XY-scatter plot works well when you only have a two dimensional series of X- and Y-variables but what do you do when you have many, many interacting variables such as the mineral composition of forage. An approach that is analogous to the simple XY-scatter plot can be used, but instead of drawing a two-dimensional plot, we have to draw a multi-dimensional plot representing all of the different variables. Unfortunately, the human brain struggles to comprehend life outside the three-dimensional world in which we live but thankfully mathematics comes to the rescue!
It is possible, mathematically, to draw a multi-dimensional plot and carry out a multi-dimensional least-squares fit and extrapolation to give us an equivalent to the R2 and Q2 values discussed above.
This multi-dimensional or multivariate approach is extremely important because it is the only way of assessing a complex array of data all of which may or may not be interacting with each other.
Understanding Forageplus Horse Feed Statistics – Outliers
Outliers are data points that don’t fit the model for some reason. Let’s look again at the simple XY-scatter plot but introduce an outlier point which is highlighted by the red circle.
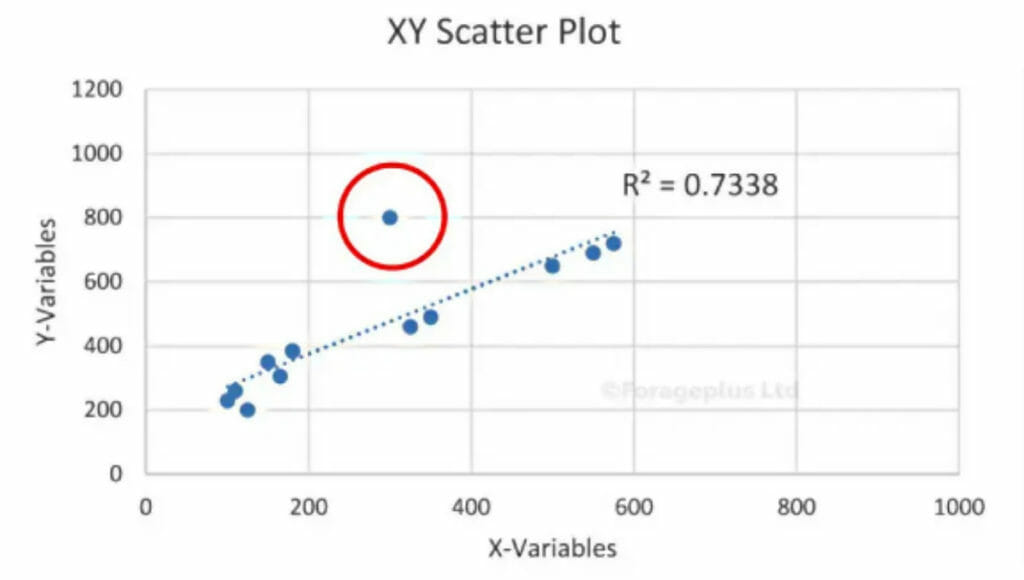
The presence of this outlier has lowered the R2 value which means we have a poorer model the value of Q2 will also be lower.
The presence of outliers can dramatically affect all of the data, for example, the average values of data points can become skewed if outliers are present. To illustrate this consider the following; the average is simply the sum of all the variables divided by the number of variables. Imagine we have 10 variables all with a value of 1 the average would be simply 10 divided by 10 which equals 1. Now suppose we have 9 variables with a value of 1 and one variable with a value of 11. The average would now be 20 divided by 10 which equals 2. Therefore the presence of one rogue variable or outlier with a value of 11 has completely skewed the data, 9 out of the 10 variables had a value of 1 so this represents the most probable value of the dataset however the rogue/outlier has made the average twice that of the most probable result.
Because outliers can dramatically skew the data we have to be able to detect them in large complex datasets and if there is justification to remove them so the data represents the more probable outcome. In the mineral reports that Forageplus receives there can be many reasons for outliers, for example:
- A sample may have been contaminated when taken, for example short grass contaminated with soil or grass cut with a rusty pair of scissors or collected/dried on a metal tray may end up with a high iron content
- There may have been an error during analysis, for example the lab analysed the wrong sample or inadvertently contaminated a sample
- Human error this could be calibration error, inputting values incorrectly etc
It is perfectly normal for there to be outliers in large datasets, the skill is being able to detect and deal with them.
Horse feed balancer comparison
Forageplus Horse Feed Balancer Mineral Data 2014-2016
We used part of our database from 2014, 2015 and 2016 to compare the mineral composition of UK forage across the three years. The same exercise was also carried out to compare the nutritional composition of UK forage and we will present these results in a second article.
Postcode analysis (using ArcGIS) showed a fairly even distribution of samples from across the country. Samples of grass, hay and haylage were adjusted based on their dry matter content to enable all of the samples to be compared to each other on a 100% dry matter basis. The following table summarises the dataset used for each year; observations are the mineral reports and the variables are the major and trace minerals analysed.
| Year | Number of observations used | Number of variables | Total number of data points |
|---|---|---|---|
| 2014 | 102 | 17 | 1734 |
| 2015 | 96 | 17 | 1632 |
| 2016 | 154 | 17 | 2618 |
Multivariate Model Overview to Determine Horse Mineral Levels
The data from all three years was analysed by a multivariate technique known as Principal Component Analysis (PCA) using the Umetrics SIMCA-P software. The following three charts show the model overview plots for each year. These plots are a summary of how well each mineral is modelled. The green bars represent the R2 value and the blue bars the Q2 value. The bigger the bars the better that mineral is modelled.
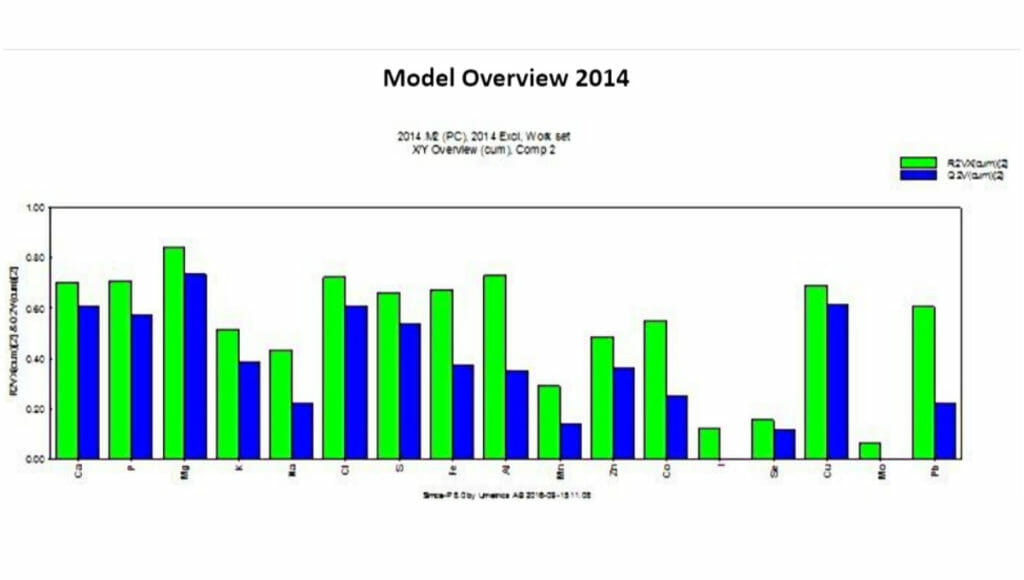
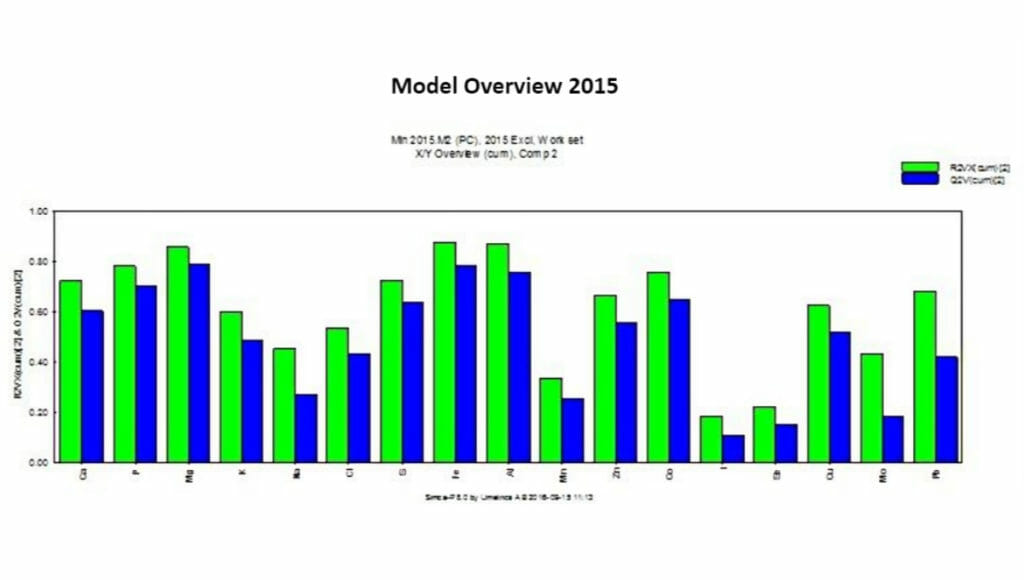
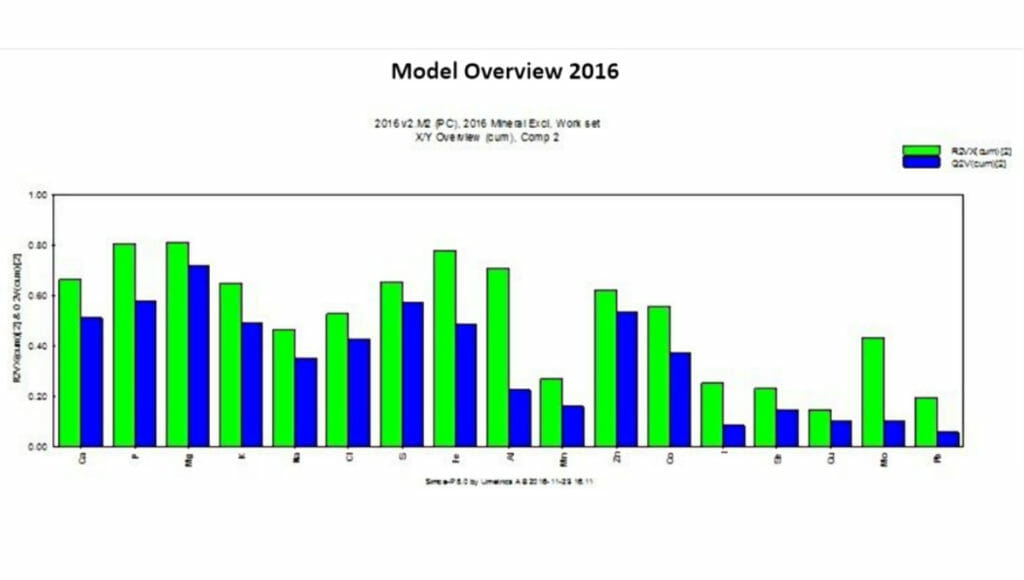
The results show the PCA models are working well for most of the minerals analysed. There are some exceptions particularly iodine (I) which is poorly modelled for all three years. Manganese (Mn) molybdenum (Mo), selenium (Se), cobalt (Co) and lead (Pb) are also less well modelled compared to the other minerals and we, therefore, need to be cautious about how we describe these minerals and their effects in a broader context.
Identifying Outliers to Enable an Accurate Statistical Average
There are several statistical multivariate tools built into the SIMCA software package that enables important outliers to be identified. For the technically informed a 2-component model was generated for each year and we used DModX on the second component as well as the Hotelling T-squared ellipse scores plot to identify outliers. We then looked at the raw dataset to identify what minerals were causing a particular observation/mineral report to become an outlier and if we felt there was justification that observation was then excluded from the dataset. After removing all of the outliers the refined dataset for each year was re-modelled.
We consistently observed that most outliers were caused by suspiciously high levels of iron that we attributed to sampling contamination probably due to the use of rusty scissors or contamination of the sample possibly with soil.
The following chart shows a plot known as the Scores plot for the 2016 dataset before removing any outliers:
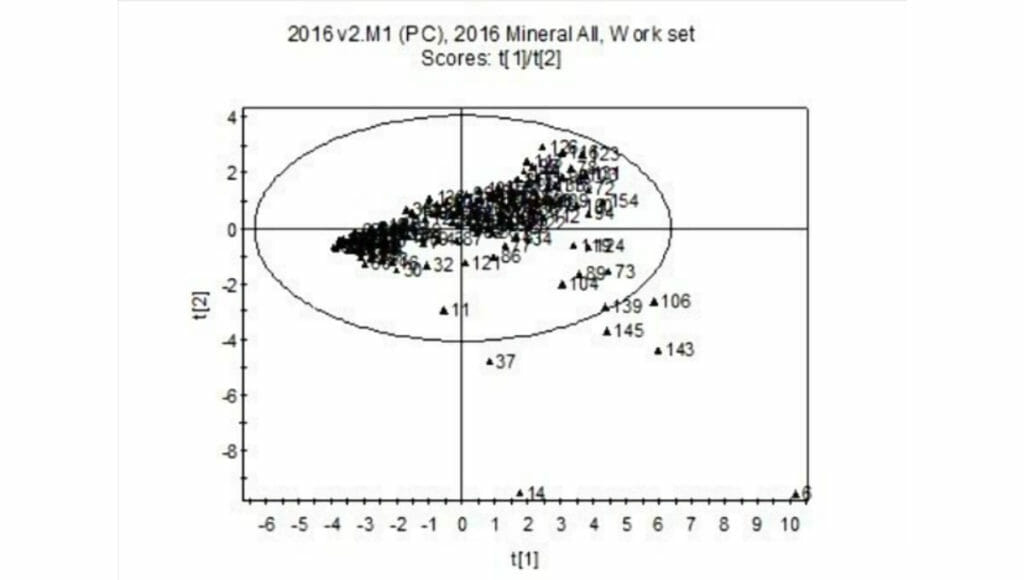
Each point is an observation and represents a complete mineral analysis report and any points that are outside the ellipse are outliers. The greater the distance an observation is from the ellipse the more significant it is as an outlier, clearly, observations 14 and 6 are strong outliers whereas observations 37, 106, 143 and 145 are more moderate outliers. All of these observations were excluded and the dataset was remodelled as shown below:
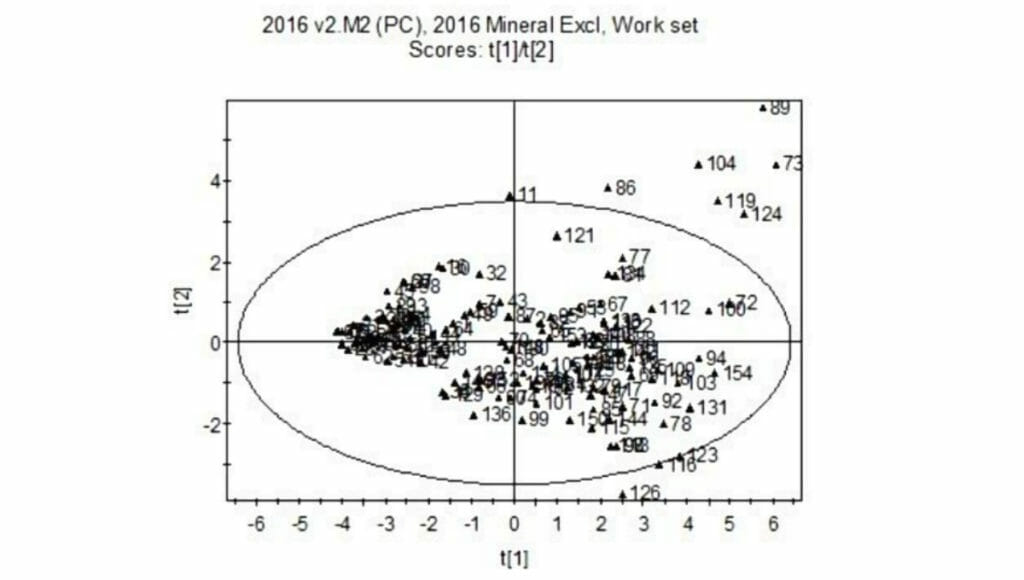
The re-modelled data still shows some outliers but these are more moderate and consistent with the data so they were left in. There is always a risk of over “trimming” a model by continually removing outliers which would lead to a model that doesn’t represent the data, fortunately, there are diagnostic tools available to warn you of this.
How Data Can Be Skewed and Why Should You Beware?
The above exercise throws up some interesting points. The average level of iron from the 2016 dataset before removing any outliers was 101.7mg/kg. Seven outliers out of the dataset of 154 observations were removed which had the effect of lowering the average iron level to 72.0mg/kg.
This is a huge difference and illustrates how outliers can dramatically skew data and is a major reason why having a large number of analysis reports/observations to base your statistics on is extremely important.
It is prudent to be very wary of any company claiming to market nutritional products formulated on a statistical basis without understanding how many reports/observations they have used in their statistical analysis and how they discovered and addressed any outliers.
The number of outliers removed for each year is shown in the table below and is also expressed as a percentage of the total dataset for each year.
| Year | Number of observations used | Number of outliers removed | Percentage of outliers in dataset |
|---|---|---|---|
| 2014 | 102 | 6 | 5.9% |
| 2015 | 96 | 6 | 6.2% |
| 2016 | 154 | 7 | 4.5% |
Scores and Loadings Plots to Inform Horse Feed Balancer Levels
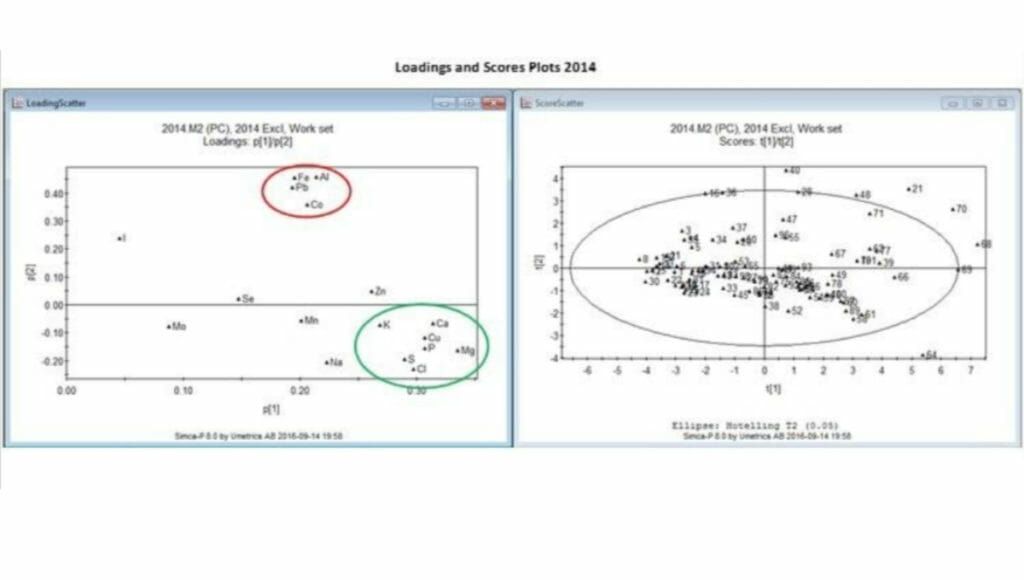
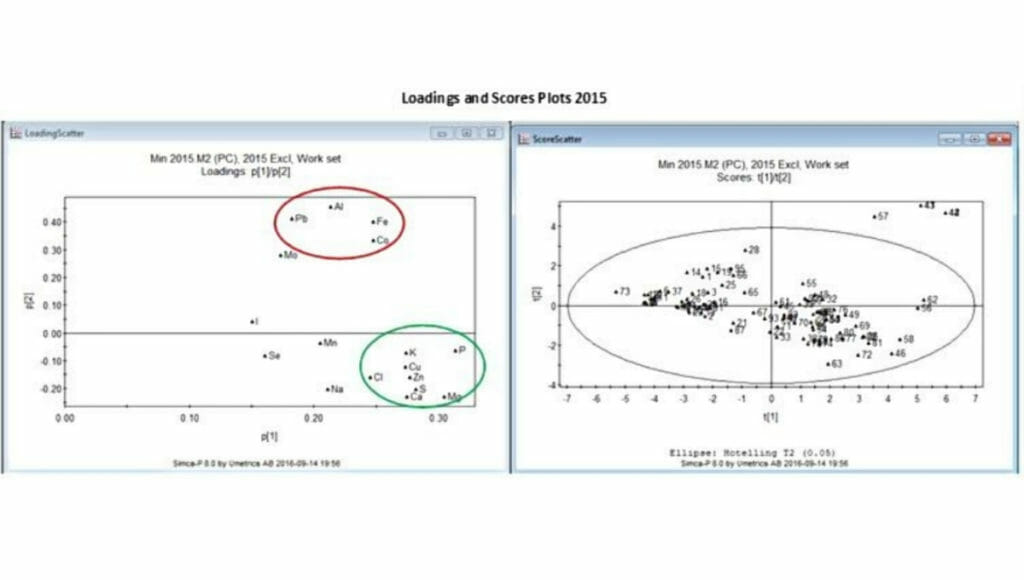
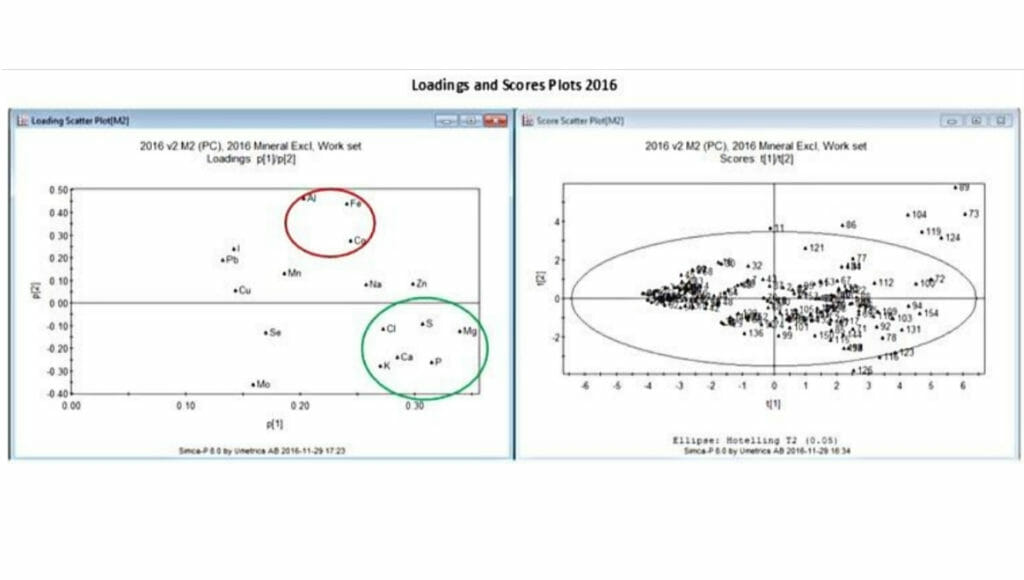
The Scores and Loadings plots summarise the multivariate models for all three years after dealing with the outliers.
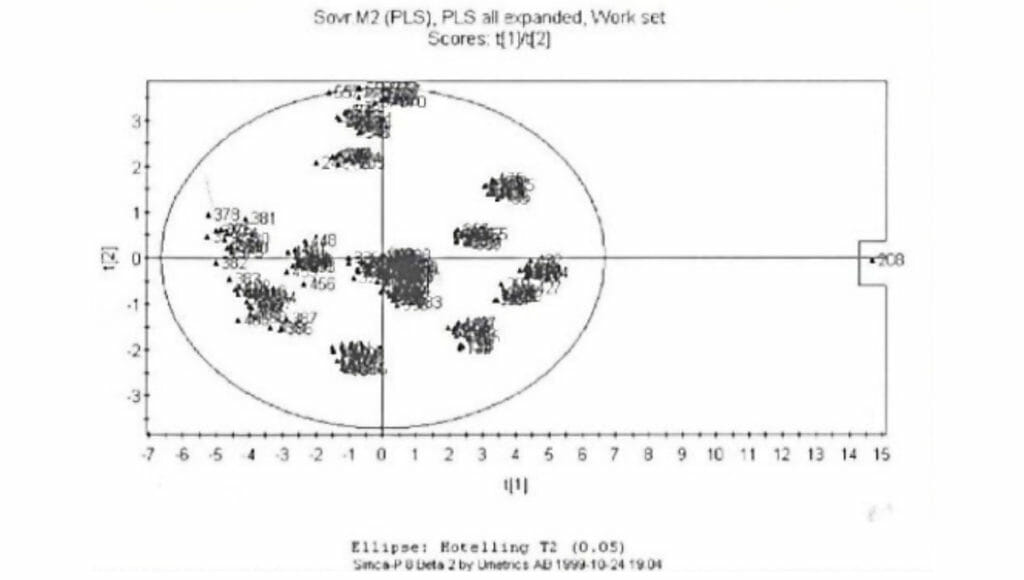
For each year the right-hand Scores plot shows the distribution of the observations. Remember each observation corresponds to a full analysis report from samples that have been received from across the country. What is interesting is there is little, if any “clustering” that is all of the observations/mineral reports are reasonably well distributed. Statistically, this indicates there is very little regional or geographical variation in forage samples (grass, hay, haylage) throughout the UK. For comparison the Scores plot below which is from a completely different dataset, actually a Swedish mine, shows strong “clustering” of the observations.
The left-hand Loadings plot shows the distribution of the variables. Remember the variables are the individual minerals analysed. The Loadings plot identifies that certain minerals are highly correlated. For example, the minerals iron (Fe), aluminium (Al), cobalt (Co) and to some degree lead (Pb) are all correlated (red circle). Similarly, the minerals potassium (K), calcium (Ca), chloride (Cl), phosphorus (P), Sulphur (S), magnesium (Mg) and to some degree zinc (Zn) and copper (Cu) are also correlated (green circle). This means whatever causes these minerals to increase or decrease will affect all of the correlated minerals, that is, they will increase or decrease proportionally together.
The minerals highlighted by the red and green circles are inversely correlated with respect to each other so for example when the red circle minerals are high it would be expected that the minerals in the green circle would be low and vice versa.
The right-hand Scores plot shows the distribution of the observations. The left-hand Loadings plot shows the distribution of the variables.
Scores plot and Loadings plot 2014
Scores plot and Loadings plot 2015
Scores plot and Loadings plot 2016
Is the Data for Forageplus Horse Feed Formulas Normally Distributed?
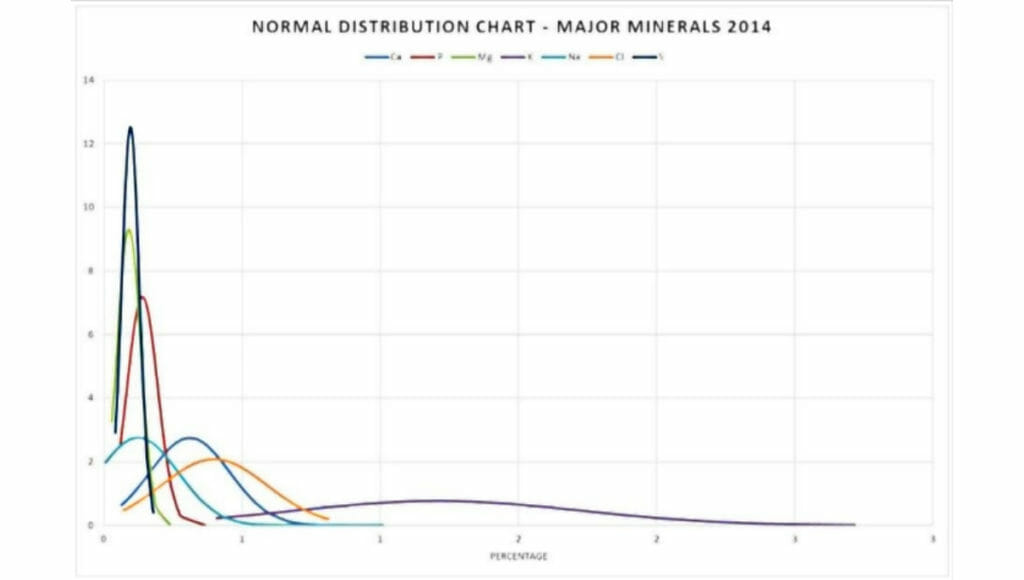
A normal distribution is a symmetric bell-shaped curve where the horizontal X-axis corresponds to the variable value, for example, the mineral percentage and the vertical Y-axis represents probability. The most probable value is also the average and so the mid-point of a normal distribution is the average (mean) value for that particular mineral.
If products such as horse feed balancers are being formulated to an average then it’s important the dataset is (1) sufficiently large to have statistical relevance (2) any outliers have been removed with justification and (3) the data is normally distributed.
The following chart shows the normal distribution plot for the major minerals from the 2014 dataset, the other years are similar. The chart shows the major minerals throughout the country are predominantly normally distributed:
Comparing Averages to the NRC guidelines for Horse Feeding
The average values for each mineral were determined on a 100% dry matter basis after removing outliers and checking the data was normally distributed.
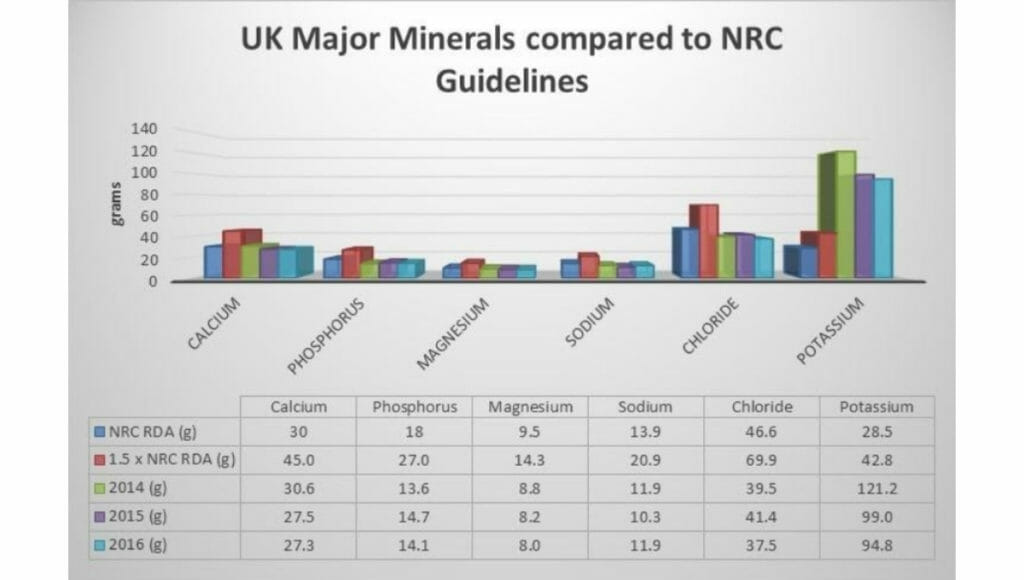
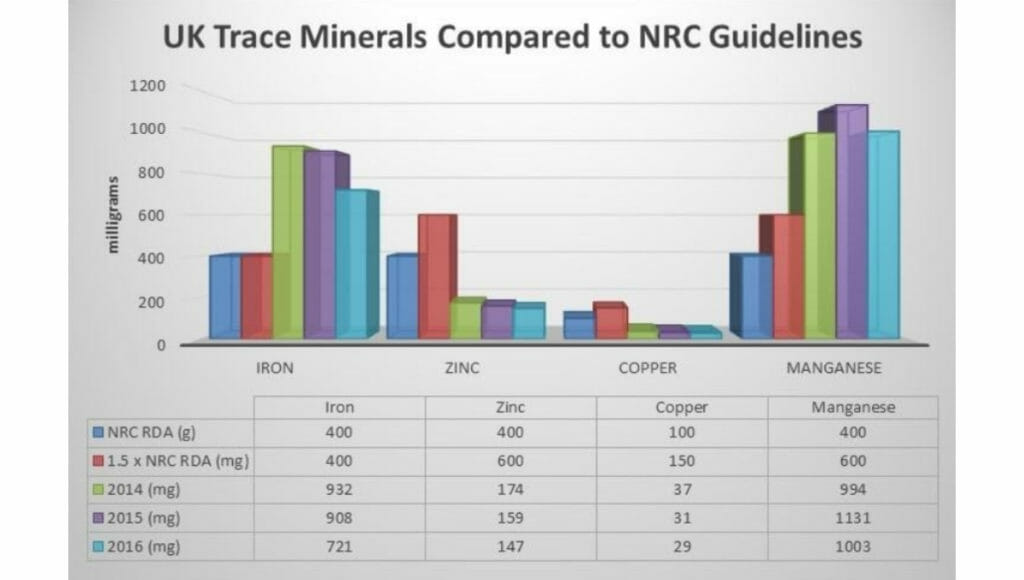
The following charts show the average 2014-2016 UK forage results compared to both the National Research Councils – Nutrient Requirements for Horses 2007 (NRC) minimum guidelines and 150% of the NRC values as recommended by Dr Kellon. 150% is recommended as a guideline because the NRC figures are described as the minimums that horses should have in their daily diet.
Please note there is no 150% value for iron because iron is so well absorbed and highly available to horses. The comparison is made using a 500kg horse in light to moderate work and eating 10kg forage on a 100% dry matter basis.
UK Major Minerals Compared to NRC Guidelines for Horse Feeding
With the exception of potassium, all of the major minerals in UK forage were lower than the 150% NRC guide values recommended by Dr Kellon. The data also suggests there was a very little year to year variation in the major minerals from the UK’s forage samples between 2014 and 2016 with the exception of potassium which was slightly elevated in 2014.
Note: 150% is used because the values in the NRC (2007) tables are described as minimums. Iron is not included in this raise due to it being highly available to the horse.
UK Trace Minerals Compared to NRC Guidelines for Horse Feeding
Both iron and manganese were significantly higher in the 2014-2016 UK forage samples than the 150% NRC values and conversely zinc and copper were significantly lower. There was no significant annual variation in the trace mineral levels although 2016 did appear to have slightly lower levels of iron and manganese.
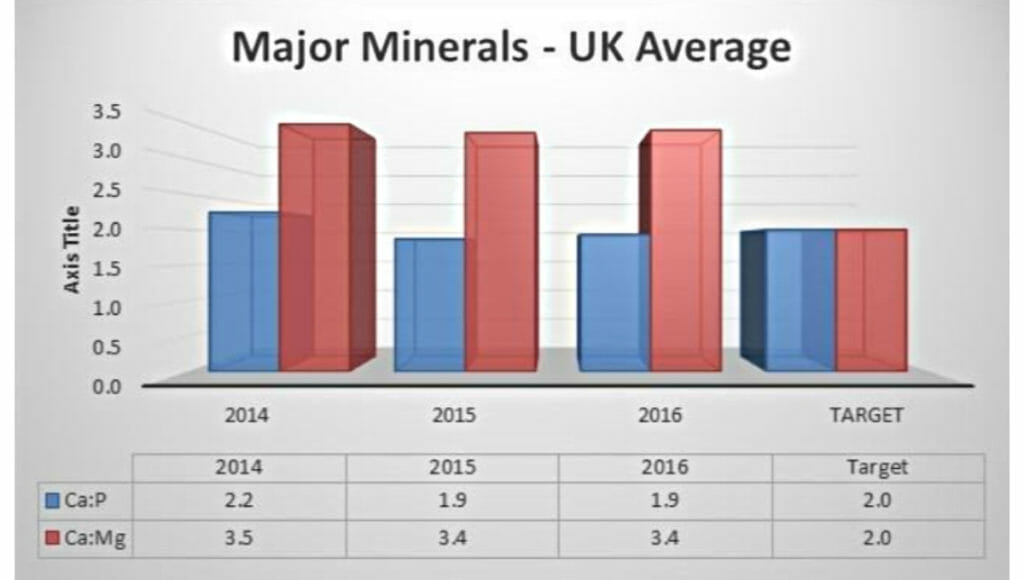
Major Mineral Ratios as Indicated by NRC Horse Feeding Guidelines
The calcium to phosphorus (Ca:P) and calcium to magnesium (Ca: Mg) ratios were very consistent between 2014 and 2016.
The ratio of Ca:P was consistently meeting the target ratio of 2.0 but the ratio of Ca: Mg was 3.0 and higher than the target value of 2.0.
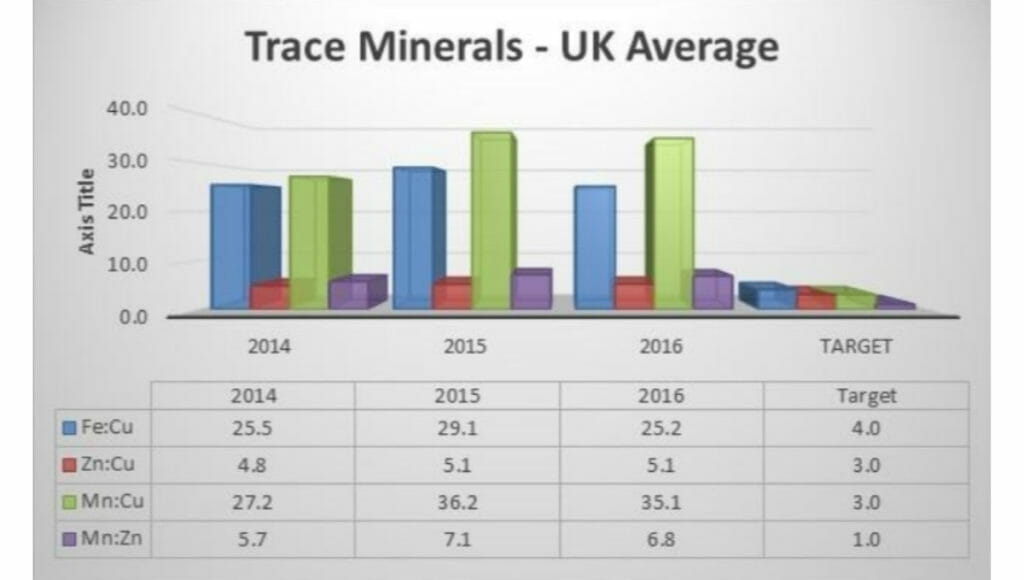
Trace Mineral Ratios as Indicated by NRC Horse Feeding Guidelines
The trace mineral ratios across all three years were very consistent in the UK’s forage. Both the iron to copper (Fe: Cu) and manganese to copper (Mn: Cu) ratios were huge compared to the target values of 4.0 and 3.0 respectively. The zinc to copper (Zn: Cu) and manganese to the copper ratio( Mn: Cu) were also higher than the target values of 3.0 and 1.0 respectively.
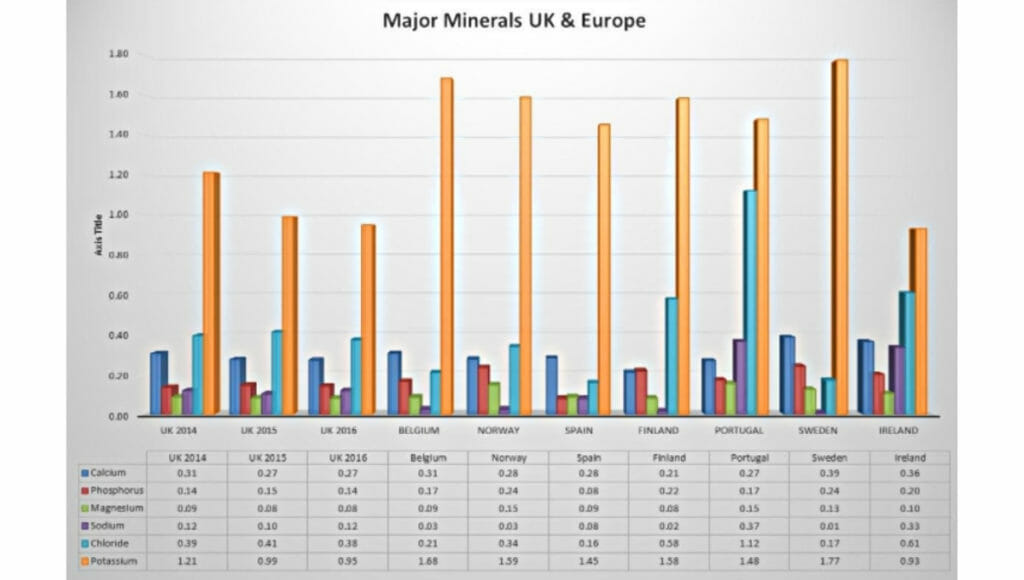
UK Forage Compared to Europe for Formulating Horse Feed Balancer
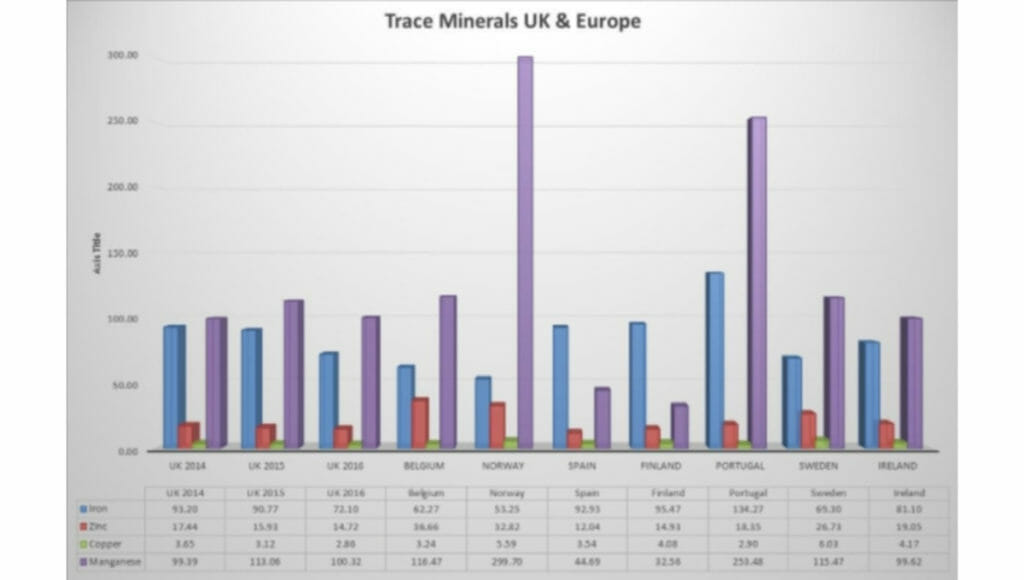
As a final exercise, we decided to compare the UK averages for 2014-2016 to a selection of samples from Europe.
PLEASE NOTE: This comparison should be viewed cautiously because the number of European samples was far less and so the statistical error associated with these samples is more significant. With this caveat in mind there are still some interesting comparisons to be made:
The major minerals in UK and Irish forage samples are very similar although the Irish samples contain higher levels of sodium and chloride. The continental European samples from as far south as Spain and Portugal to the Scandinavian countries of Norway and Sweden all have higher levels of potassium compared to the UK and Ireland. The levels of phosphorus, calcium and magnesium are very similar for all of the countries.
The trace minerals in the UK are almost identical to those in Ireland. The Portuguese samples appear to have high iron and manganese and similarly, the Norwegian samples have high levels of manganese.
How This Affects Horse Owners Choosing a Horse Feed Balancer?
- Calcium is usually not necessary as good amounts are found on average in forage. In addition many feeds such as beet pulp , grass nuts and alfalfa which are used in both bagged feeds and fed as separates to horses as bucket feeds contain high levels of calcium. It is therefore not useful to add further calcium to the daily diet in the form of a supplement.
- It is clear that a targeted ‘forage focused’ approach modelled on careful statistical analysis of the grass, hay or haylage your horse eats is far superior in ‘balancing’ horse diets than a broad spectrum approach.
- Choosing a balancer should involve looking first at the greatest proportion of the diet, grass, hay or haylage, and then making sure the company creating the horse feed balancer understands the way the quality of this forage impacts horses.
- Phosphorous is often low. Although the average in forage would suggest that extra supplementation is often not needed, at Forageplus, we feel the prevalence of feeding high calcium bucket feeds supports the addition of this in our balancers for adult horses. For young horses levels have to be much higher than for adult horses so our formulas use our data to supplement both phosphorous and calcium at high levels for young and growing horses.
- Magnesium is a very poorly supplied mineral throughout the world. Dr Kellon has found that adult horses benefit greatly from a 2:1 ratio of calcium with magnesium. Horses with equine metabolic syndrome (EMS) benefit from an even higher level of magnesium where calcium is at a ratio of 1.5:1 with magnesium . Forageplus horse feed balancer formulations provide excellent levels of magnesium and we use a particularly high quality magnesium oxide which is always below 50ppm iron.
- Iron should not be added to horse feed supplements or be present in vitamin and mineral premixes because iron is over supplied in all forms of the horse’s diet and impacts upon the uptake of copper and zinc.
- It is unwise to add manganese to the horses daily diet as levels in forage, on average, are already too high and impact on the absorption of other more poorly supplied minerals, zinc and copper.
- Selenium is poorly supplied on average in the horse’s diet and so additional supplementation at around 1 – 2mg per day is indicated.
- Sodium is poorly supplied in forage throughout the UK and especially in Europe. Additional supplementation through feeding salt should be carried out and a good guide is to feed an adult horse 5 – 10 grams of salt per day. If horses are working and thus sweating they may need 30 – 60 grams extra per hour of continuous sweating.
- Iodine is poorly modelled meaning that an average was difficult to determine as there is a high level of fluctuation of this mineral across the whole of the UK and Europe. However Forageplus suggest that working on 2-4mg per day will supply adequate levels of iodine to adult horses. Caution should be exercised when feeding pregnant mares iodine and analysis of forage should always be carried out to check levels of minerals for safe and effective feeding of brood mares.
- If you are in the UK you do not need to worry about regional variation. All over the UK and Ireland, if you analyse averages then there is no clear regional variation that can be used to formulate an accurate horse feed balancer for a single area. Part of the problem is how do you determine where one area starts and one finishes. In addition one field well looked after can be greatly different to one next door which is not. Indeed it is more accurate and safer to take an average over the UK and Ireland and then aim if you can to test your individual grass, hay or haylage to check that your forage reflects the common average. If you find what your horse is eating is outside this norm you can then adjust accordingly and safely. In our opinion and from the results of our multivariate analysis any regional specific products are devised solely for marketing and not based on fundamental science and statistical common sense.
- The same, concerning regional variation, can be said for Europe and as Forageplus gain more data we will continue to carry out rigorous statistical analysis to check levels for all horses eating UK and European forage. For now there is not enough evidence to suggest a different average is needed for Europe.
- Forageplus balancers are formulated not just on the figures in the tables of the NRC but also with reference to what is the greatest proportion of the horse’s diet. By carefully considering all variables Forageplus have formulated horse feed balancers to reflect what is commonly deficient as revealed by our use of multivariate analysis and can clearly demonstrate the reasons for the levels and choices of minerals in our balancers.
- Coupled with an intelligent approach and formulas we also believe that only the best quality minerals should be used in any product fed to horses. We only formulate our products with this in mind.
Read more about our forage focussed horse feed balancers here.
Interested in testing your own forage? Take a look at our UKAS accredited analysis services here.


